Running an Inventory Trends Report
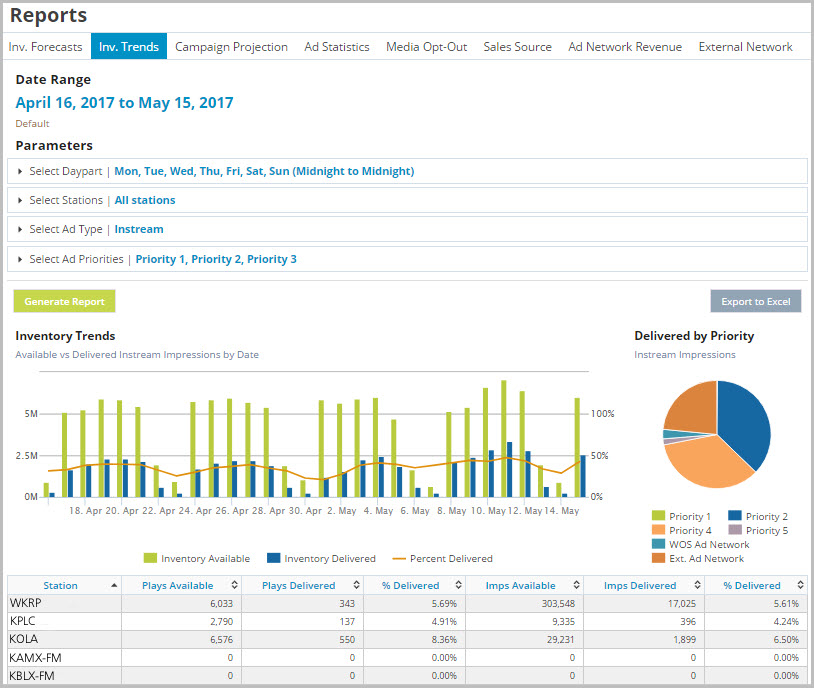
The Inventory Trends Report displays historical information from ad plays or impressions and shows projected future information of ad inventory. On the right hand side of the results there is a bar graph displaying ad inventory by priority type. Forecasting applies historical information for plays or impressions which is useful in case there is any potential inventory scheduling conflicts.
Note: The Inventory Trends report can now be produced for a 6 month range.
Click the Ad Management tab, then the Reports sub-tab, then select Inventory Trends. |
To run an inventory trends report:
1.In Inventory Trends, select any or all of the filters for the report by clicking the expand button.
2.In Date Range, select a range.
3.In Select Daypart, select the days of the week, Start Time, and End Time.
4.In Select Stations, select specific stations by market, format, language, or band.
5.In Available Stations, use the double arrows to move stations from Available Stations to Selected Stations.
6.In Select Ad Type, select In-Stream or Gateway.
7. In Select Ad Priorities, select Priorities 1-6, Ext. Ad Network, or AmperWave Streaming Ad Network. The impressions delivered by the selected priorities will appear in the graph and table of the report. Note that after the report is generated you can disable and enable properties, and the report will be updated dynamically. This lets you easily see how much each priority group has delivered.
8.In Select Inventory Type, select Plays or Impressions.
9.Click Generate Report.
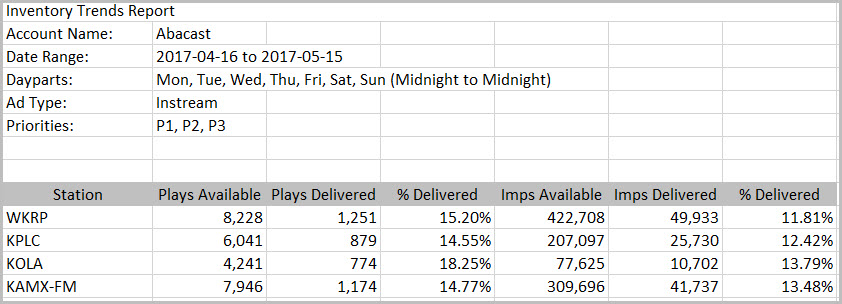
10.Click Export to Excel to export the results to a spreadsheet.
Exported report results: